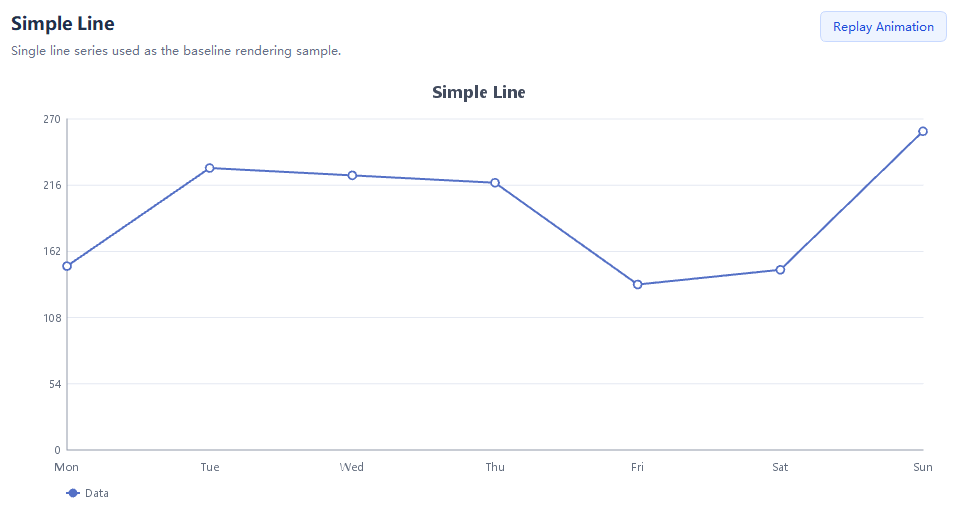
Simple Line
A basic line chart that highlights how a single data series changes across time or categories.
Qt-UI ChartKit turns recurring Qt interface work into reusable assets, so teams can spend more time on product behavior and business workflows.
View DocsProvides line, column, pie, scatter, and financial chart capabilities for common business dashboards.
Supports themed visuals, reusable chart widgets, and product-ready Qt Widget integration.
Designed for monitoring screens, analytics tools, and internal business systems.
Organized by chart type, the ChartKit previews highlight high-performance rendering for very large datasets.
Line charts show continuous data trends and are suitable for monitoring curves, business metrics, historical comparison, and time-series analysis.
View Docs
A basic line chart that highlights how a single data series changes across time or categories.
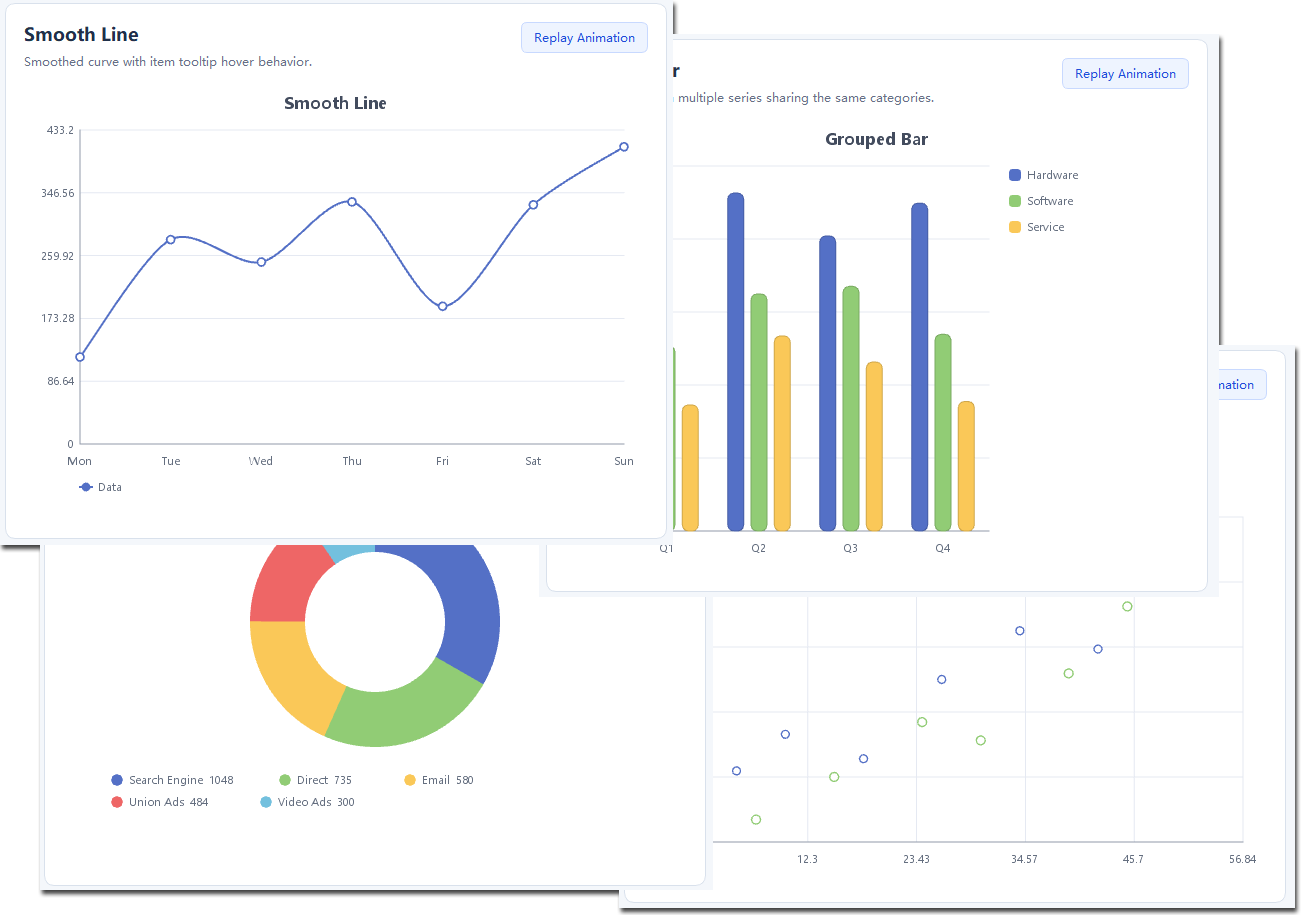
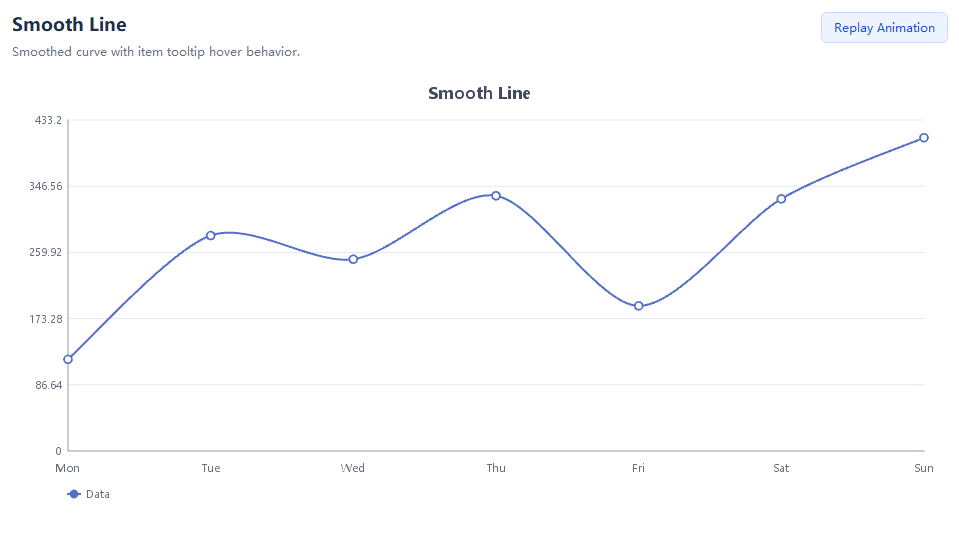
A smooth curve chart for more continuous-looking trends and softer visual movement.
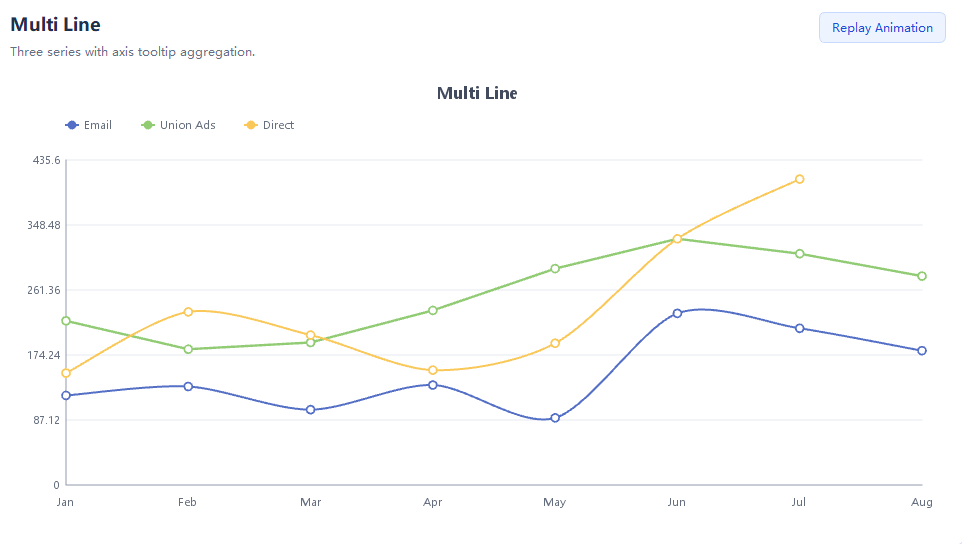
A multi-line comparison chart for comparing several metrics in the same coordinate system.
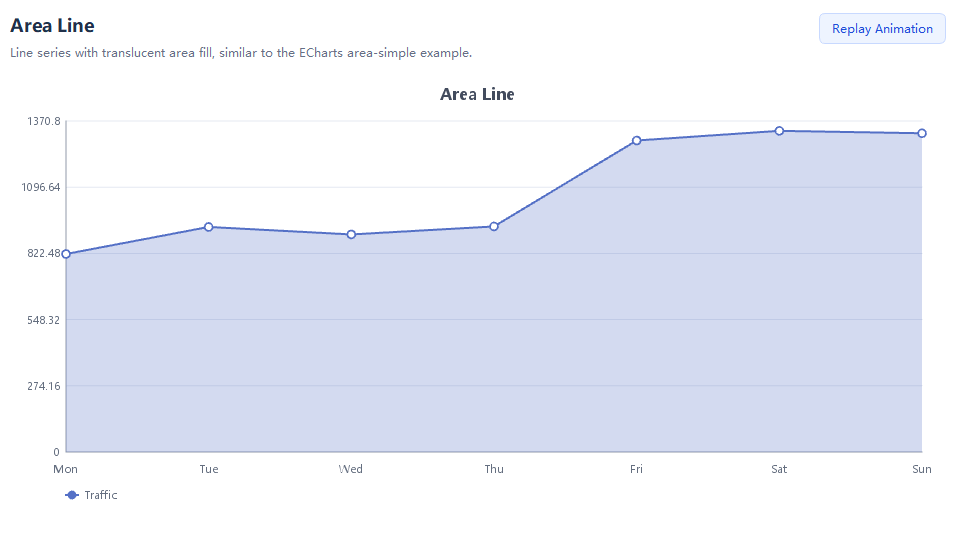
An area line chart that emphasizes value scale and trend changes through filled regions.
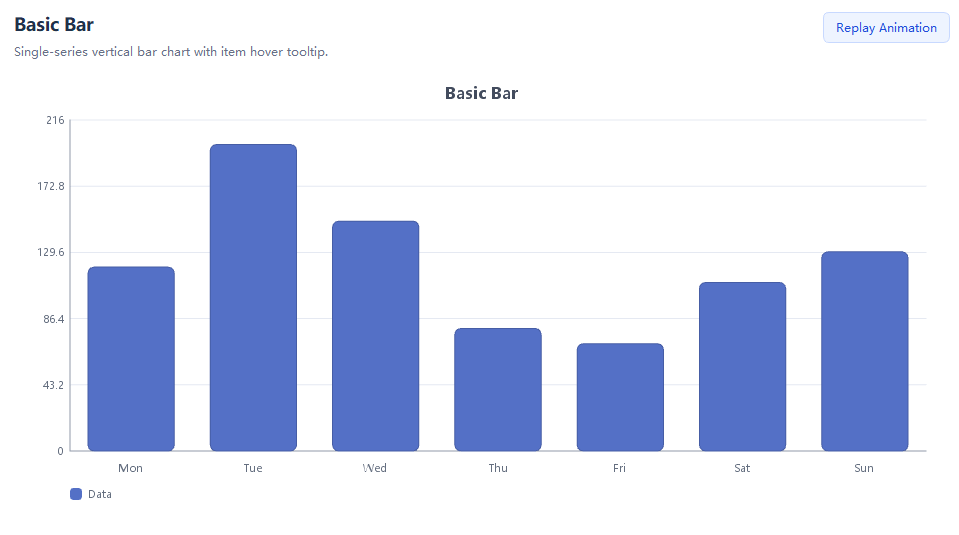
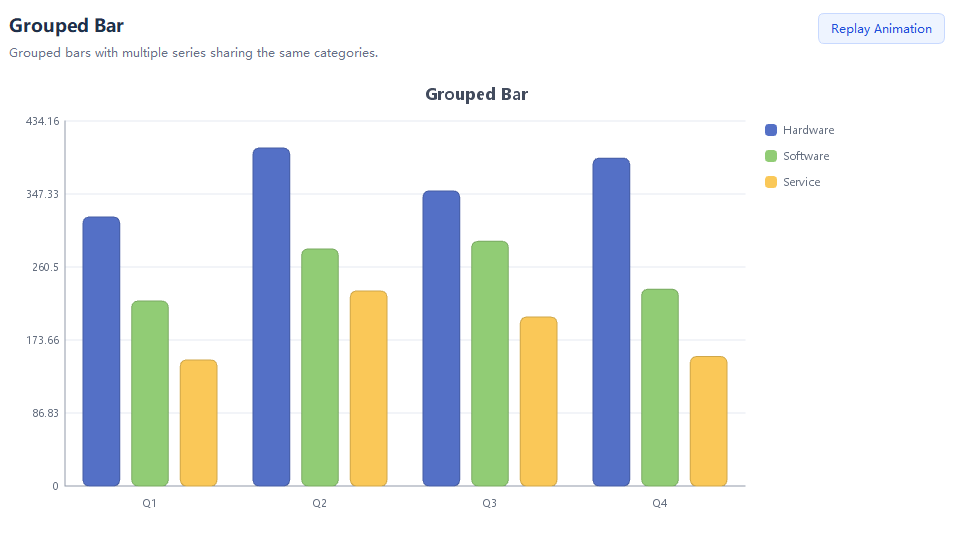
Bar charts compare values across categories or groups and are suitable for rankings, statistics, and horizontal business comparisons.
View Docs
A basic bar chart that compares category values through clear column height differences.
A grouped bar chart that presents multiple series under the same category for side-by-side comparison.
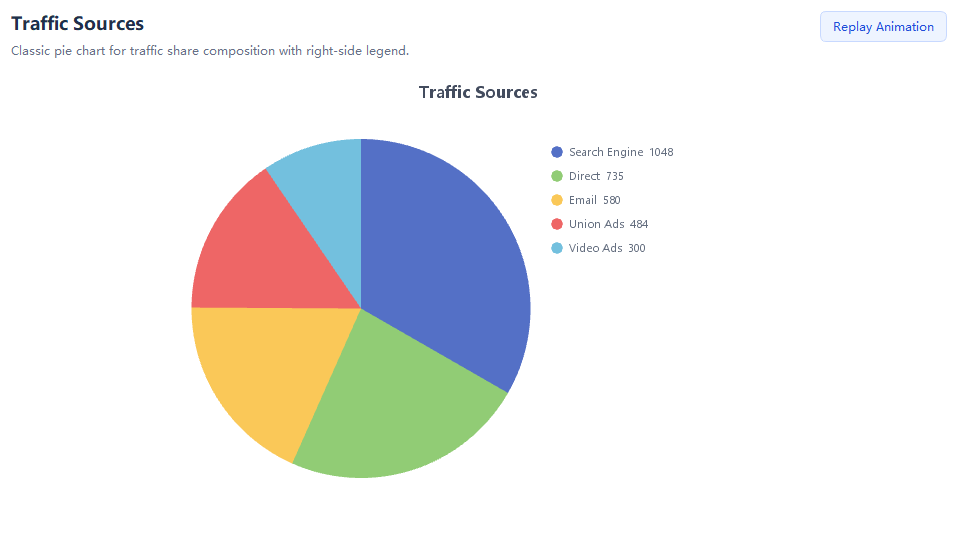
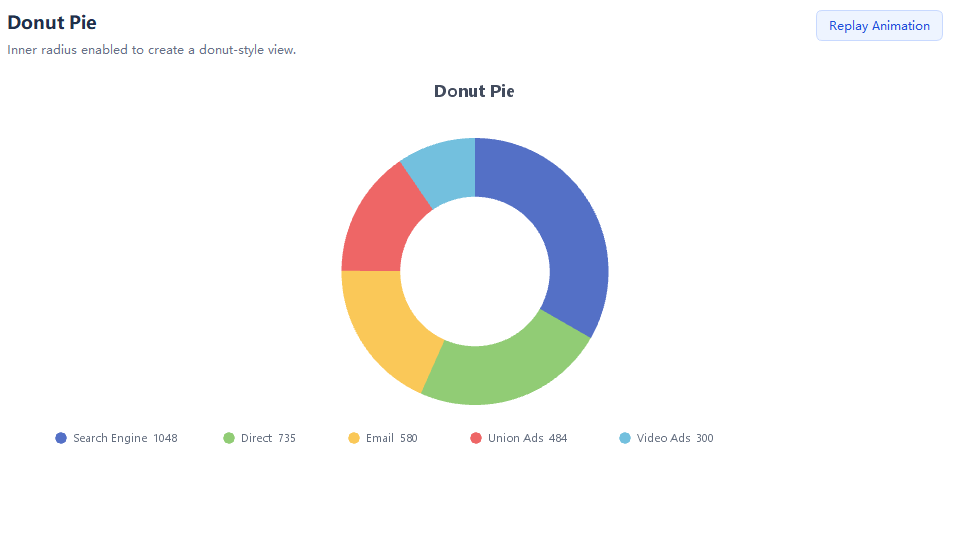
Pie charts show part-to-whole relationships and are suitable for composition analysis, category share, resource distribution, and summary data.
View Docs
A basic pie chart that uses sector area to show each category share within the whole.
A donut chart that keeps part-to-whole expression while leaving center space for summary information.
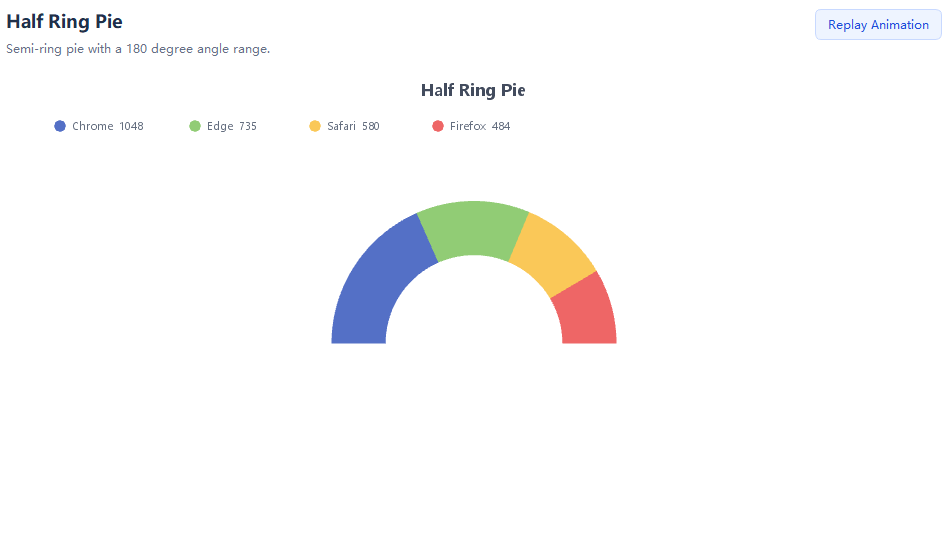
A half-ring pie chart for compact dashboards where a lighter visual footprint is preferred.
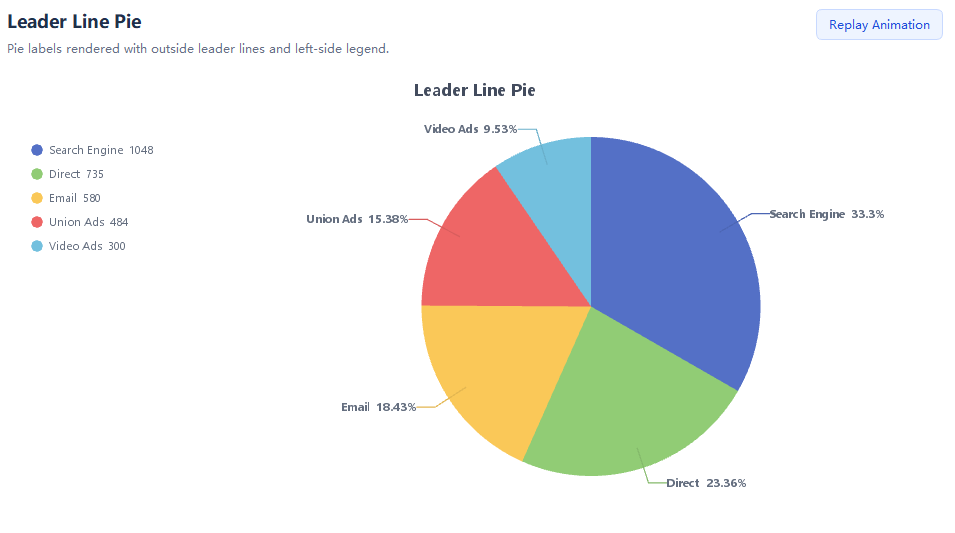
A pie chart with leader-line labels for scenarios with more categories and clearer labeling needs.
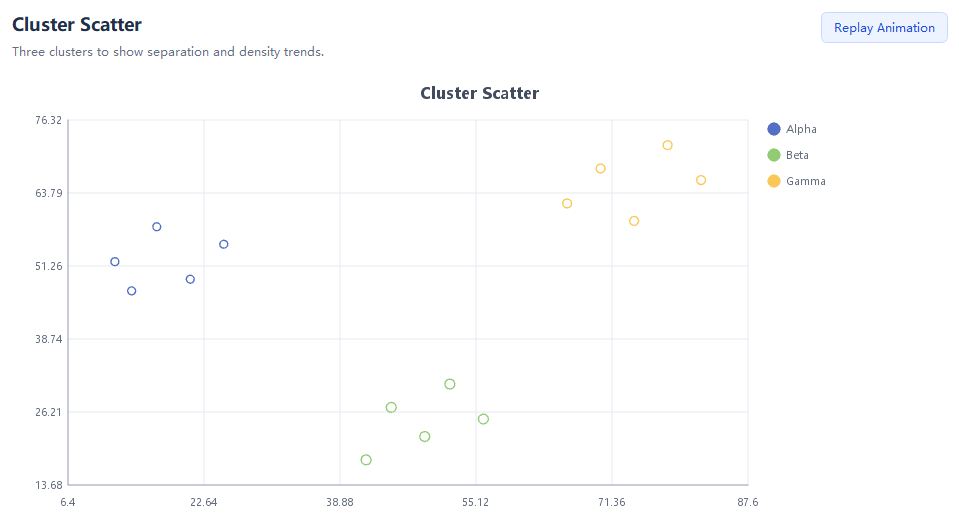
Scatter charts show relationships between two numeric variables and are suitable for correlation analysis, clustering, and outlier discovery.
View Docs
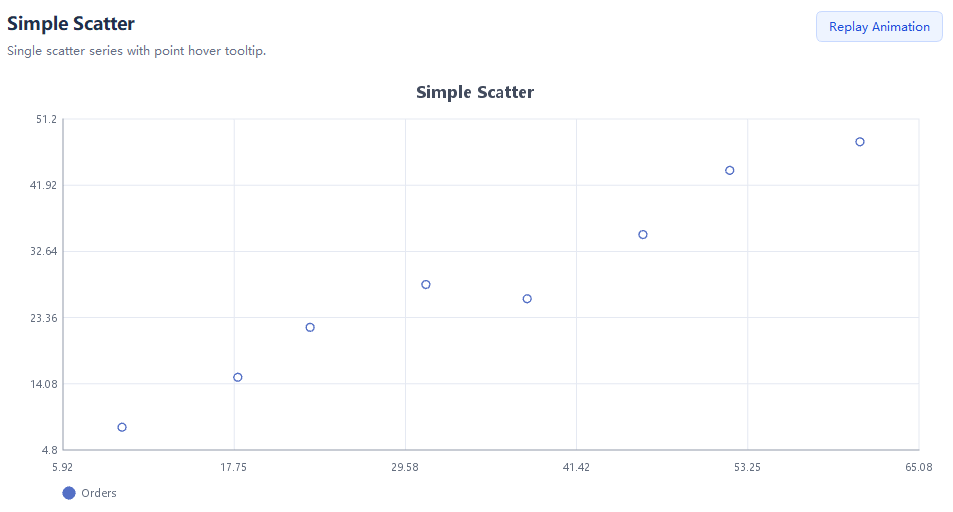
A basic scatter chart that shows sample distribution in a two-dimensional coordinate system.
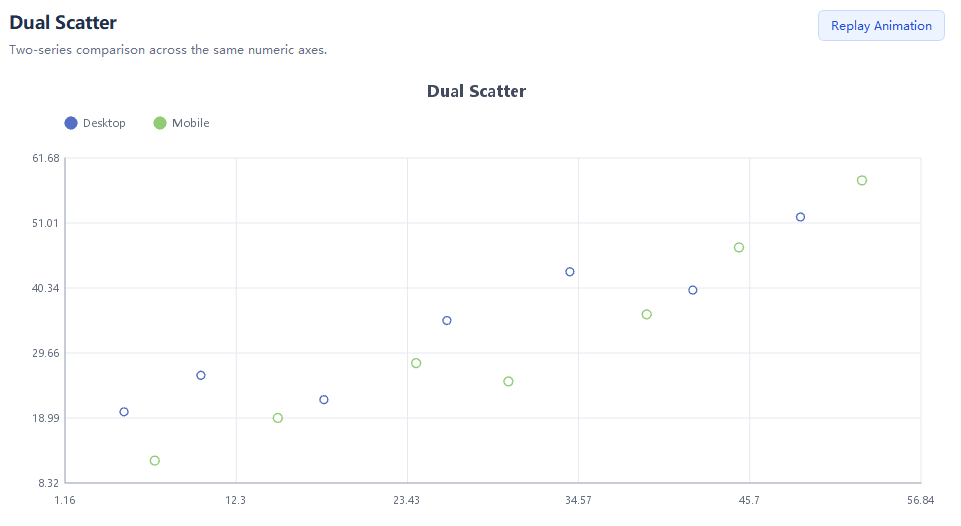
A dual-series scatter chart for comparing two sample groups in the same coordinate system.
A clustered scatter chart that highlights sample clusters, dense regions, and outliers.
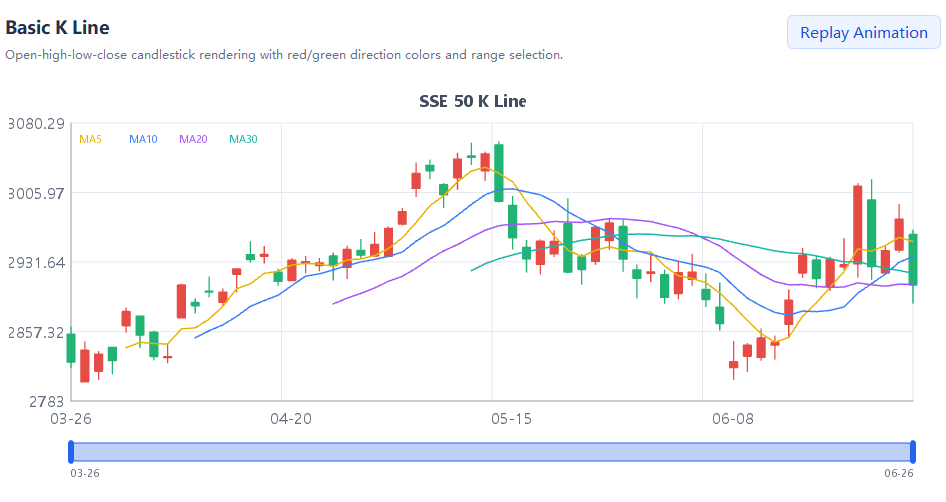
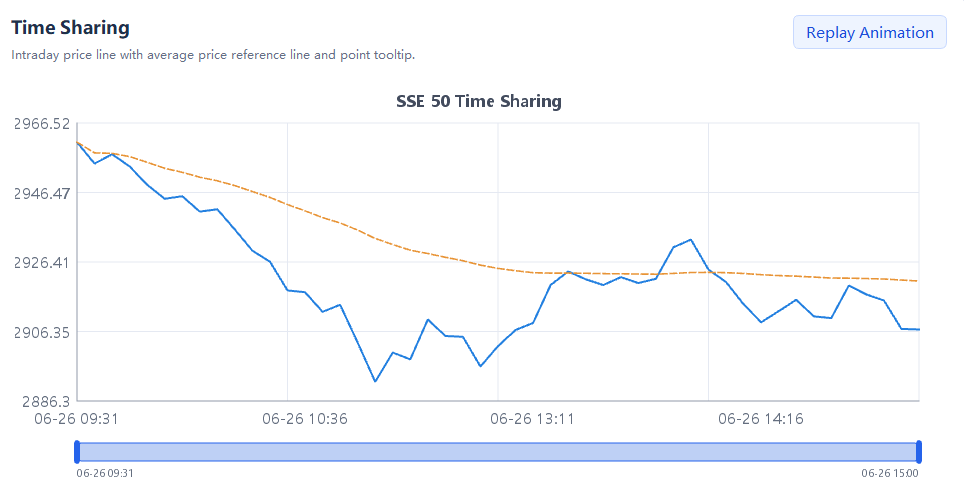
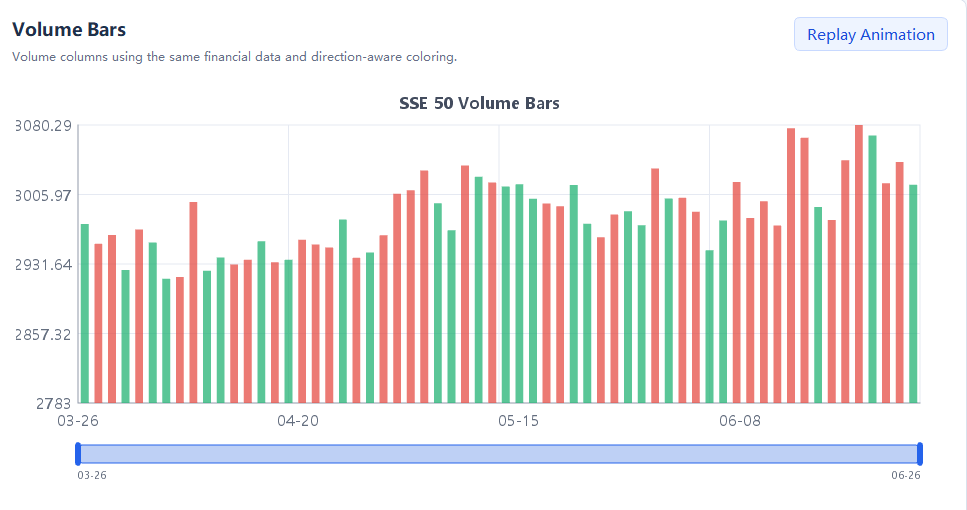
Financial charts visualize market data such as candlesticks, intraday price movement, and volume analysis for trading dashboards.
View Docs
A candlestick chart for open, high, low, and close price analysis with direction-aware colors.
An intraday time-sharing chart that displays price movement with an average price reference line.
A volume chart that reuses financial market data and highlights trading activity with direction-aware bars.
The trial edition is only for evaluation, learning, and prototype validation. Source code is not included and commercial use is not permitted. Paid license tiers are intended for commercial use and include the corresponding source package.
| Feature / Edition | Trial Edition Free | Basic Edition (ChartKit) RMB 1,280 | Full Edition RMB 12,800 |
|---|---|---|---|
| Description | For evaluation, learning, and prototype validation only. Source code is not included and commercial use is not permitted. | Includes the complete source code for this product, for one commercial project, with one year of free version upgrades. | Includes the complete source code for all four Qt-UI products, for unlimited commercial projects, with one year of free version upgrades. |
| Usage | Evaluation / prototype validation / non-commercial use only | Current product / single commercial project | All four products / unlimited commercial projects |
| Source and Assets | Trial package, source code not included | Complete source package for the current product | Complete source packages for all four products |
| Updates | No guaranteed updates | One year of free version upgrades | One year of free version upgrades |
| Support | Trial feedback | Email and ticket support | Email, tickets, and priority support |
Enter your name and email to receive the trial edition download link. Source code is not included; the trial is only for evaluation, learning, and prototype validation, and commercial use is not permitted. For commercial use and full source code, purchase Basic or Full Edition. Phone, company, and notes are optional.
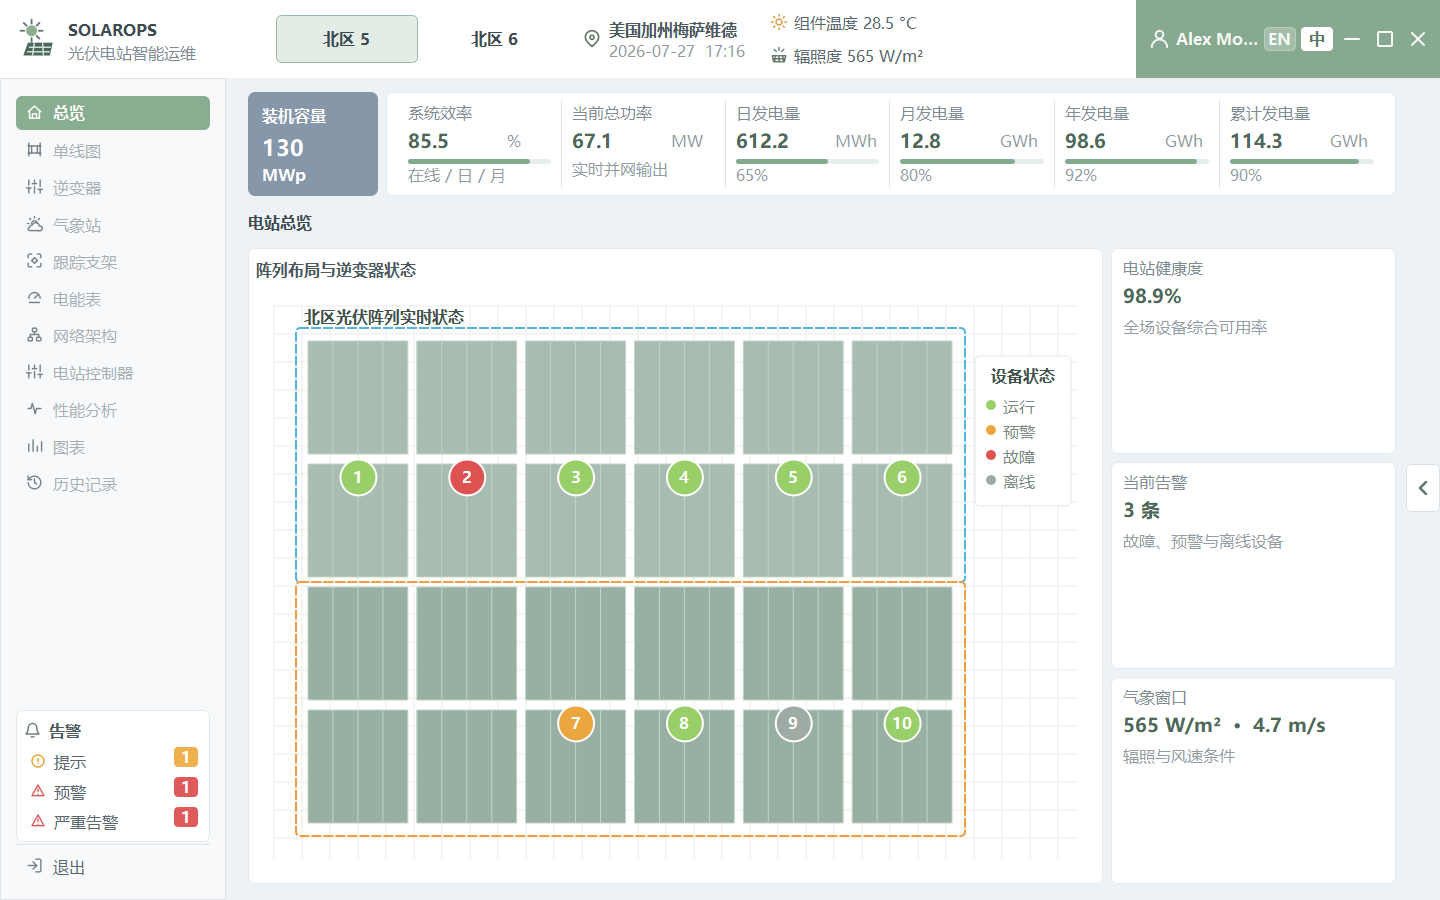
See how StyleKit, WidgetKit, ChartKit, and AgentKit work together in industrial monitoring, energy, and clinical workspace scenarios.
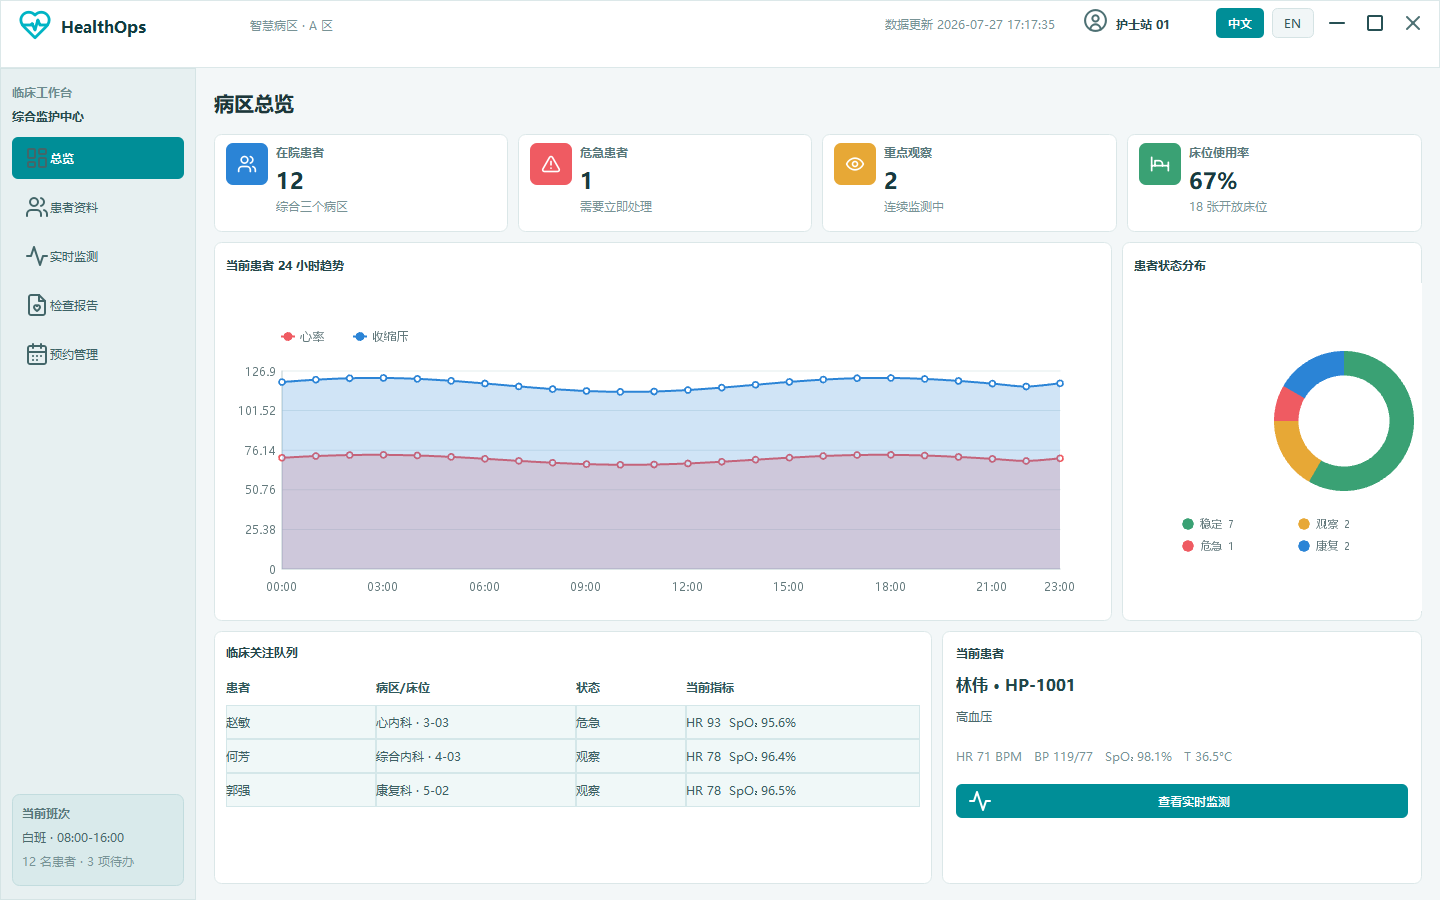
A clinical demo for ward overview, patient list, vital trends, reports, and appointment tasks.
A refinery demo for process flow, live instruments, prioritized alarms, trend drawers, and operator handling.
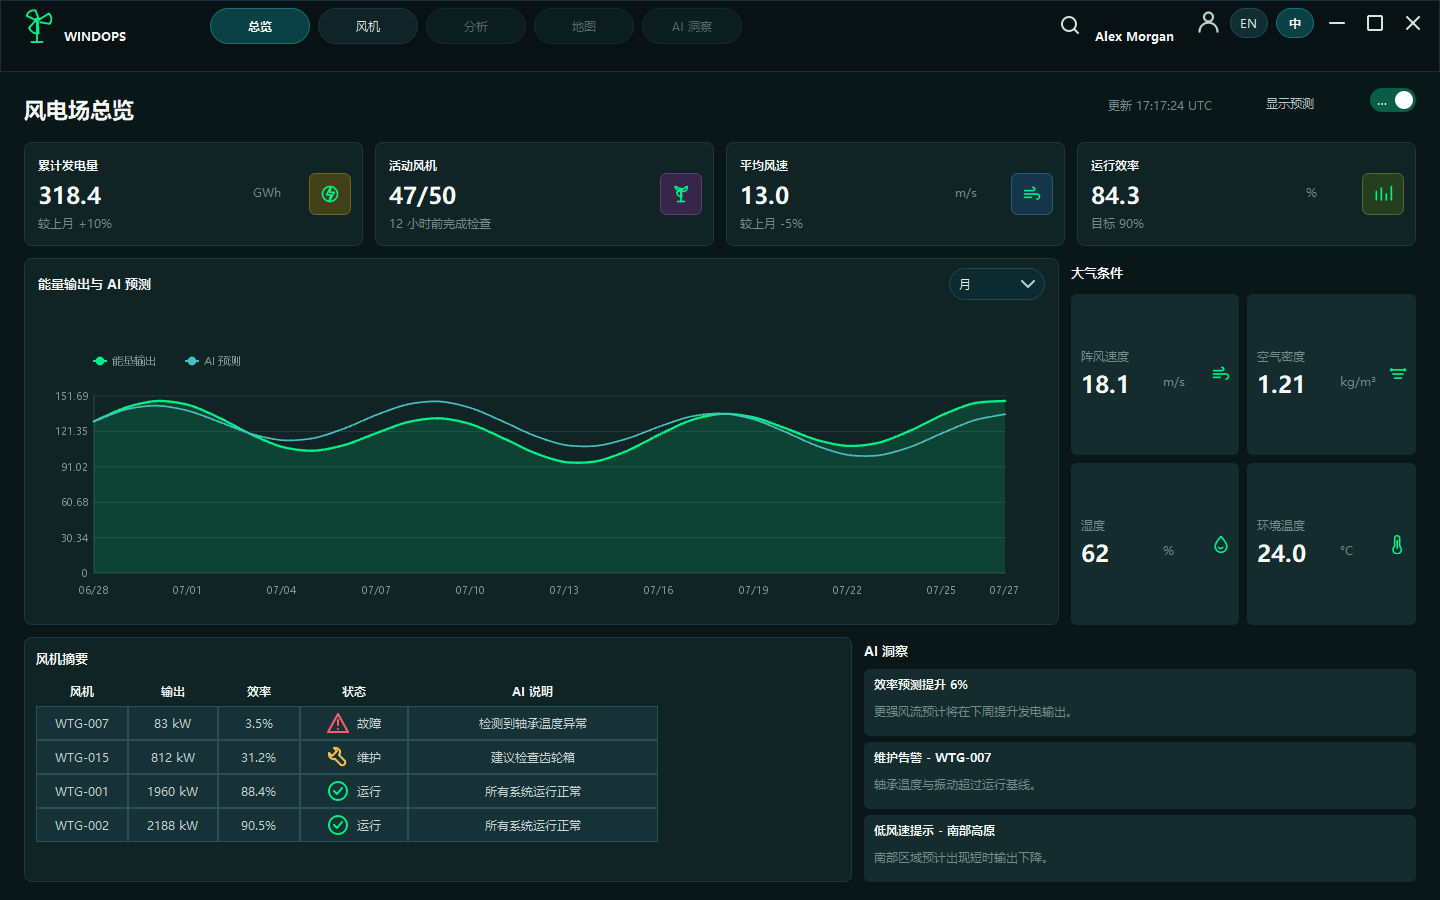
A wind-farm demo for operations overview, turbine filtering, status sorting, maintenance drawer, and power trends.
Basic and Full editions support commercial use. Basic Edition includes the current product, while Full Edition includes all four products. The order form creates an order and starts Alipay checkout; after payment, licensed source packages are available from the Member Center.